-
You are provided a zip file named "derecta_3Lextended_Jan2008_fosmid9.zip".
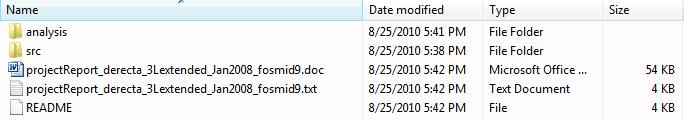
Unzip this file you will obtain a folder named "derecta_3Lextended_Jan2008_fosmid9".
This folder has two subfolders: "analysis" and "src", and three files:
two of them are project report files and one is a README file, from which you
can get more description about the contents of the subfolders.
-
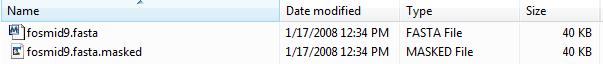
Go to subfolder "src", get sequence named "fosmid9.fasta.masked". This is a plain text file.
Use this masked genomic sequence when the genomic sequence is needed.
-
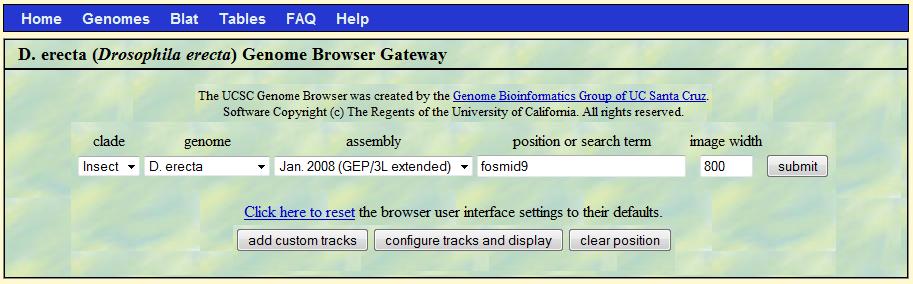
Go to GEP Genome Browser, select "D. erecta" for genome,
"Jan.2008 (GEP/3L extended)" for assembly and type "fosmid9" in the "position or search term" box,
then click "submit" button.
-
In the genome browser,
in the "Mapping and Sequencing Tracks", turn the option for "Base Position" to "full" and click "refresh" button;
in the "Genes and Gene Prediction Tracks", turn the option for "Genscan Genes" to "full and click "refresh" button;
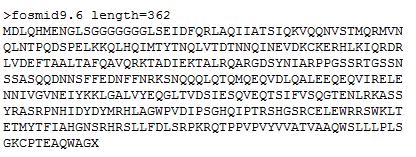
click one predicted gene by GenScan (for instance the one named as fosmid9.6), obtain the predicted
protein sequence in the next page.
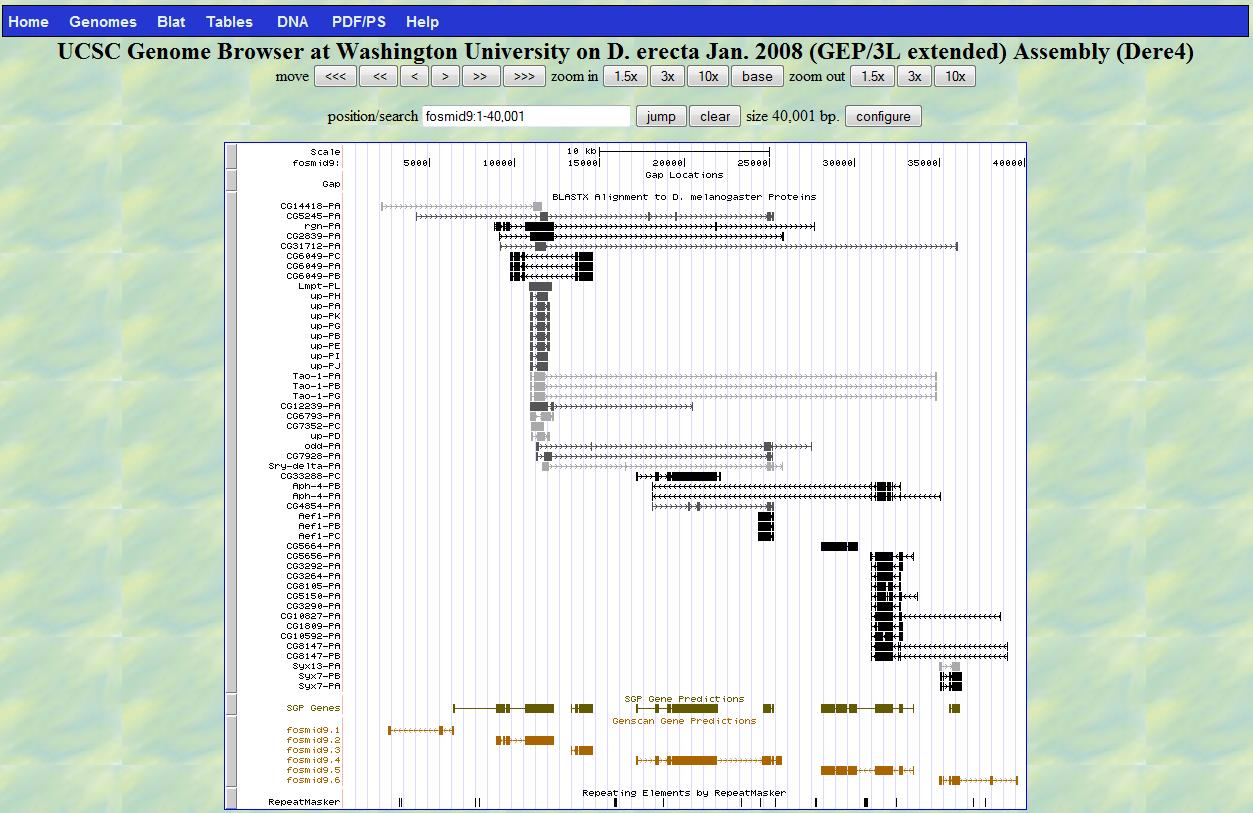
Predicted Gene (fosmid9.6)
-
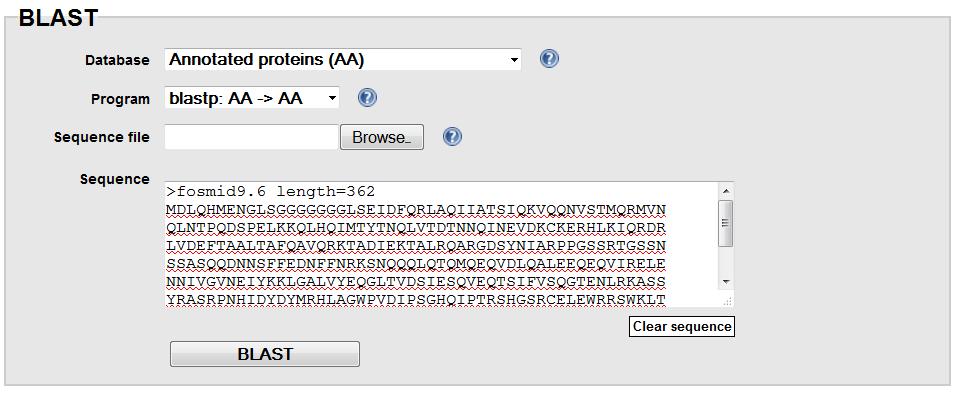
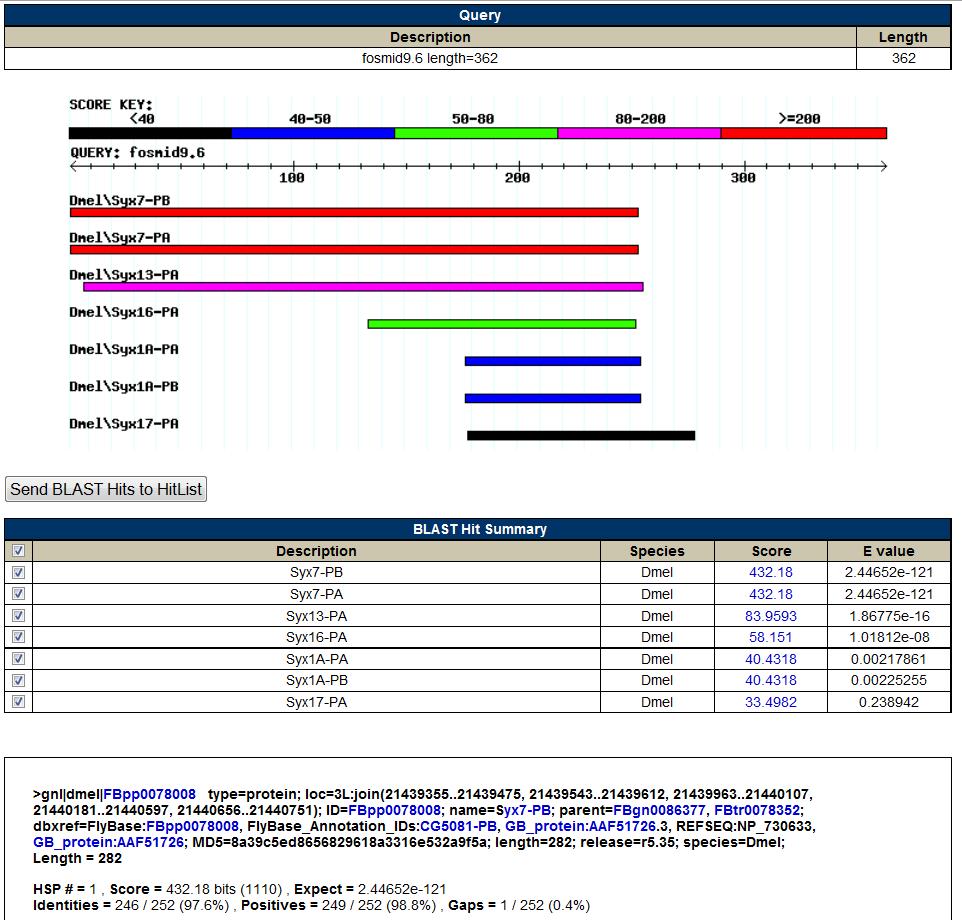
Use blastp on the flybase website, choose
"Annotated Protein" database, search the obtained predicted protein in the previous step
against annotated D. mel protein database. Find the best match and determine the gene name in D. mel.
Adjust blast parameters when needed.
BLASTP on Flybase:
BLASTP result for the predicted gene (fosmid9.6):
-
Search this gene in the GEP
gene record finder, find D. mel gene details (exon amino acids sequences, gene structure etc.)

In this fosmid9.6 example, the D.mel gene symbol is "Syx7" and the gene record is shown below:
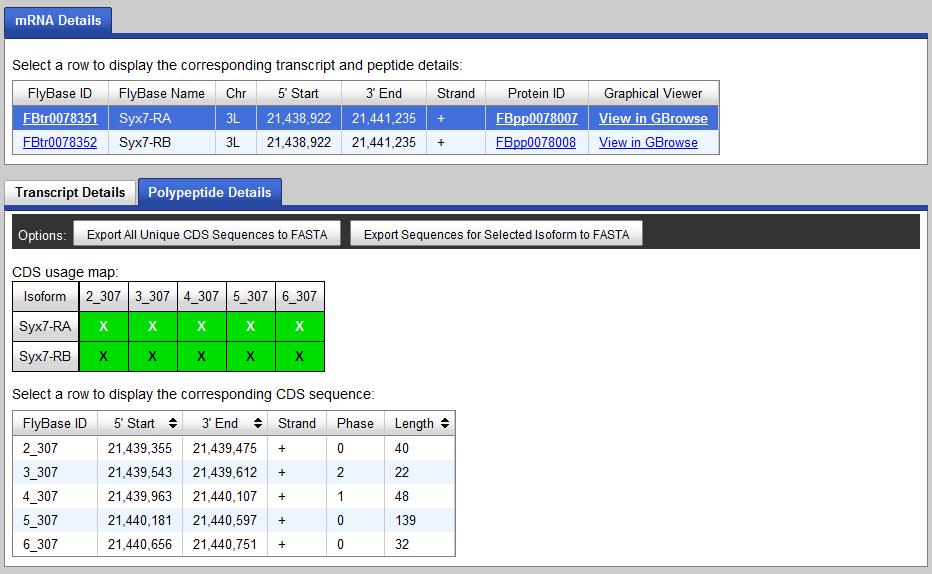
This gene has two isoforms: Syx7-RA and Syx7-RB. Each isoform has 5 exons (2_307, 3_307, 4_307, 5_307, 6_307). For
this particular example, these two isoforms of the gene has identical gene structure in the coding region.
For some genes, different isoforms have different gene structure and you should be aware of which isoform you are
work on (by default, the first isoform is selected).
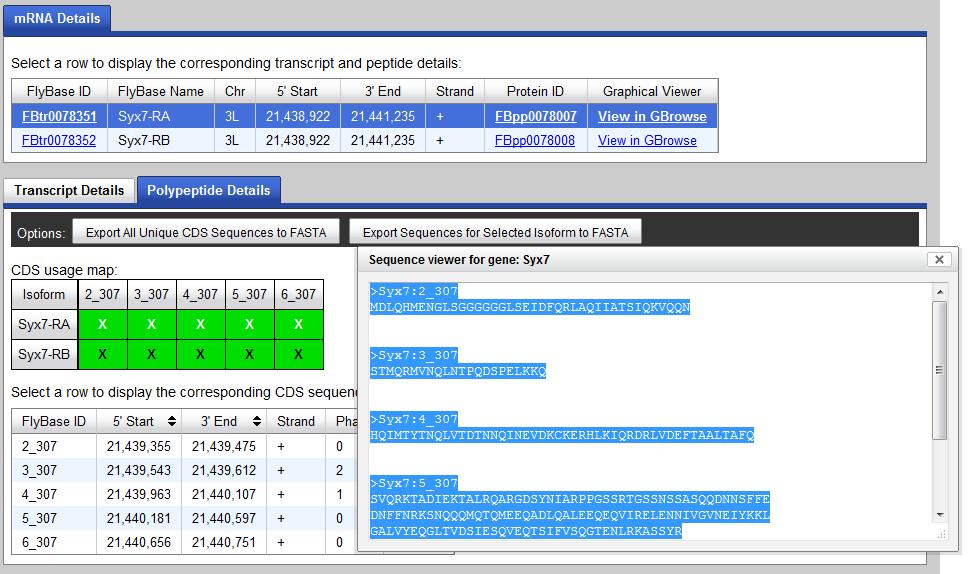
When you work on your gene, you are also suggested to get a screenshot of this gene record and
put it into a word document. Then you click "Export Sequences for Selected Isoform to FASTA" tab to get
the exon sequences of this isoform.
-
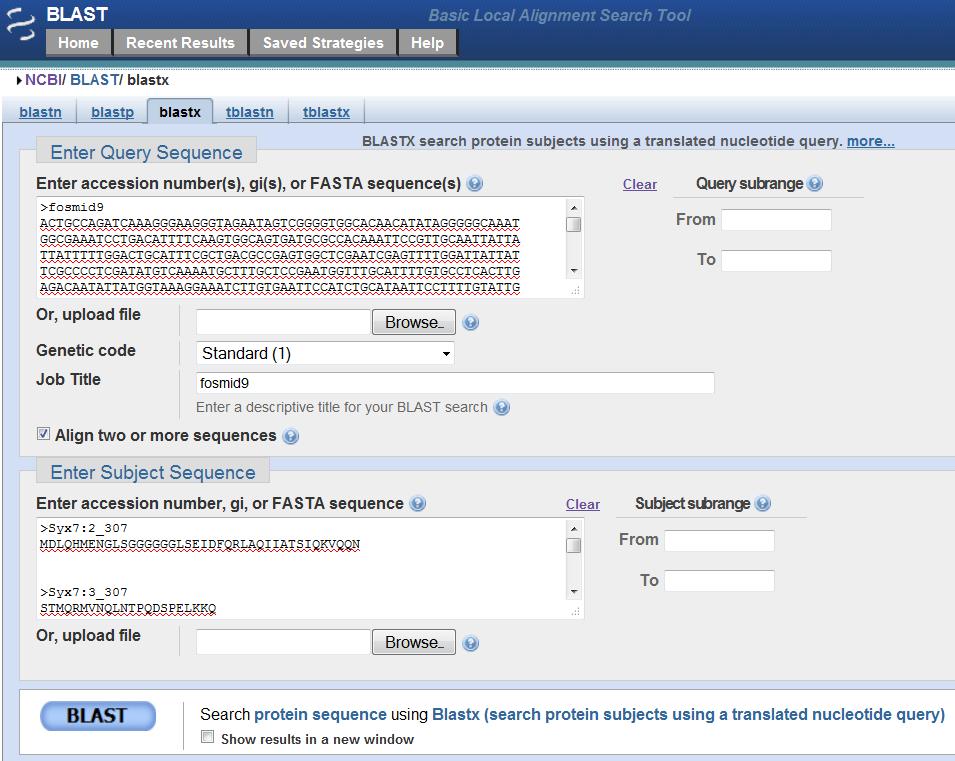
Search the masked genomic sequence ("fosmid9.fasta.masked") against each amino acid sequence
of exon in each isoform of D. mel using blastx
on the NCBI website (The genomic sequence as query and each exon as subject. Make sure you change expect value
to 0.1 and check off the "low complexity region"). Copy and paste the obtained alignment into the word document.
BLASTX search:
BLASTX search result summary:
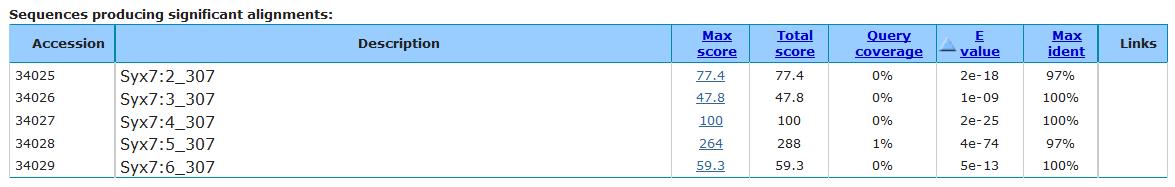
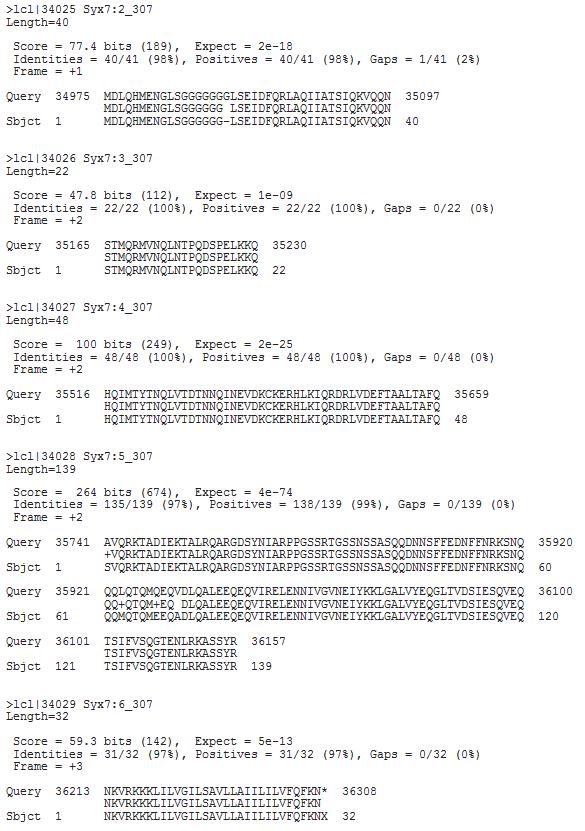
Alignment generated from BLASTX search:
Clean up the blastx output by removing insignificant matches, and draw a picture of your gene structure
based on the gene record from gene record finder and the blastx output. Here is the procedure:
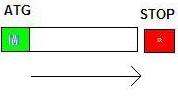
Assume you have five exons in the isoform of the gene you are working on.
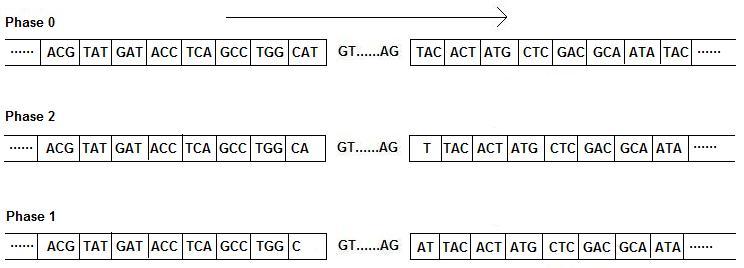
If "Frame" in blastx output is +1, +2, or +3

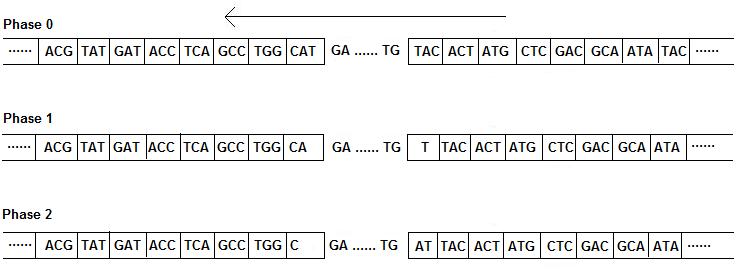
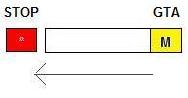
If "Frame" in blastx output is -1, -2, or -3

The arrow indicates the direction you should read the sequence. In this particular example, the picture for positive frame will be used.
-
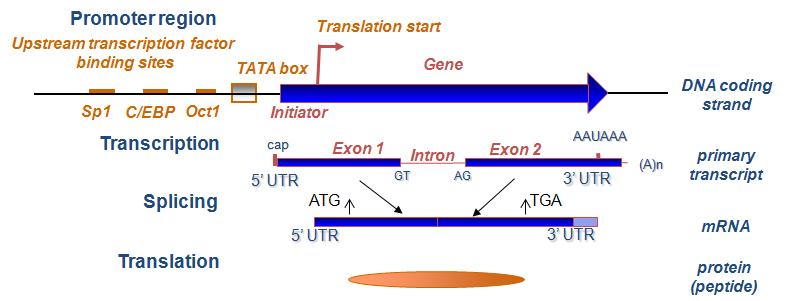
Determine precise exon boundary by using signals (ATG, GT, AG, TAA,TAG,TGA), phase,
conservation and frame information in the genome browser
If "Frame" in blastx output is +1, +2, or +3
If "Frame" in blastx output is -1, -2, or -3
In the genome browser, you will determine the correct boundaries of each exons at the neighborhood of
matched regions given in the blastx alignment. The boundaries are determined by searching for the
start codon (ATG), splice sites (GT, AG), stop codons (TAA, TAG, TGA), and matched phases.
One specific example to example the whole procedure is given below.
- First, you work on the start of the first exon (matched to exon Syx7:2_307 in D.mel).
>lcl|34025 Syx7:2_307
Length=40

 Score = 77.4 bits (189),  Expect = 2e-18
 Identities = 40/41 (98%), Positives = 40/41 (98%), Gaps = 1/41 (2%)
 Frame = +1

Query  34975  MDLQHMENGLSGGGGGGGLSEIDFQRLAQIIATSIQKVQQN  35097
              MDLQHMENGLSGGGGGG LSEIDFQRLAQIIATSIQKVQQN
Sbjct  1      MDLQHMENGLSGGGGGG-LSEIDFQRLAQIIATSIQKVQQN  40
According to the alignment from blastx, the translation frame is +1, and matched region in the
genomic sequence is 34975-35097 and it matches from the beginning to the end of the D.mel exon (1-40).
In the genome browser, you want to display the start of exon in the middle of the browser.
Since the beginning of the first
exon in this gene in the analyzed genomic sequence is expected to be around the matched position to the
beginning of the D.mel exon (Syx7:2_307), in other words, around 34975, you want to specifically
focus on this position (34975) to perform the analysis in the genome browser. To achieve that goal,
you provide a range in the genome browser by +/-10 to this number (34965 - 34985). For all other exon boundaries,
you will use the same strategy to show the desired boundary in the middle of the browser.
Now you need to check a few items in the genome browser before you determine the exon boundary. For each gene,
this check only need to be done once.
-
First, after you provide the specified range (34965-34985) in the "position/search" box and click "jump" button,
you should see four new rows you did not see when the whole fosmid was displayed. The first row is the DNA
sequence of the fosmid in this given region.
The second, third, and fourth rows are the three possible translations of this DNA sequence, with
different reading frames. If you do not see these rows, you should go to "Mapping and Sequencing Tracks" and
change the option for "Base Positions" to "full", then click the "refresh" button in that track.
-
Second, you need to check the arrow (--->) at the top left corner of the browser.
-
When the frame is +1, +2, or +3 in the blastx alignment, this arrow should point to the right hand side.
In this case, the second to fourth new rows in the genome browser correspond to frame +1, +2, and +3, respectively.
-
When the frame is -1, -2, or -3 in the blastx alignment, this arrow should point to the left hand side.
If the arrow points to the left hand side, the three rows correponds to frame -1, -2, and -3, respectively.
To switch the direction of the arrow, you just need to click on the arrow.
For this particular example, the arrow at the top left corner of the browser should point to the
right hand side since the frame is +1 according to the alignment from blastx. You also should
look for signals in the first translation row to determine the boundaries of the first exon.
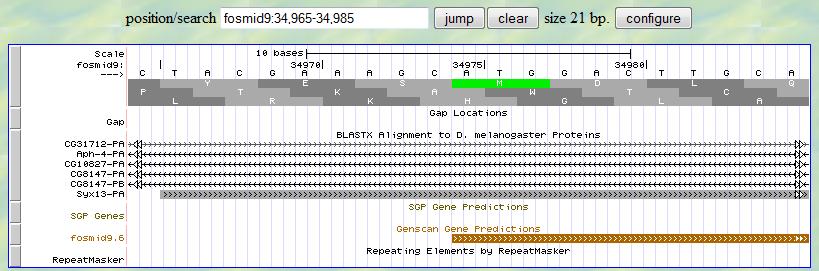
Now you can look for the start codon (ATG) around 34975 since this is the first exon of this gene.
In the genome browser, the start codon is shown as a green box with a white "M" in the middle
of the box. Remember you are looking for the signal in the first translation row (frame +1). Apparently,
the start codon starts at 34975 in that row. Therefore, the 5' end boundary of the first exon is
34975.
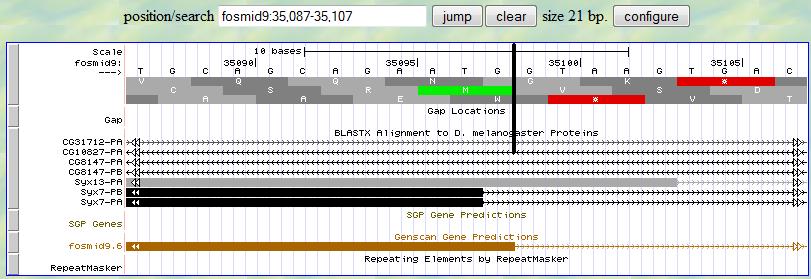
Then you can start to identify the 3' end boundary of the first exon. Again, according to
the alignment from blastx, you know this boundary is at the neighborhood of 35097. You provide
a range (35087-35107) to display this position in the middle of the browser. You are still search for signal in the
first translation row (frame +1) and you are looking for a splice signal (GT) around 35097. You notice that
there are multiple GTs available in this region and preference should be given to the one closest to the matched
position (35097. This rule is applied to all the other splice sites.
You notice that right after 35098, there is a splice signal (GT). Since the exon boundary is right before the splice site, in this case, 35098 is the 3' end boundary of the first exon.
The next step is to determine the phase of the following exon. Since there is one additional nucleotide (G) after
complete codons at the boundary of the first exon, the phase of the following exon is 1 and you expect to see two
nucleotides before the beginning of complete condons in the second exon.
Therefore, you have the desired information for the first exon:
Start: 34975
End: 35098
Phase: 1
-
You apply the samilar procedure on the second exon. The only difference is, you do not look for start codon any more.
For both ends, you look for splice sites. You look for 'AG' at the 5' end boundary
and 'GT' at the 3' end boundary. You also need to make sure that the phase matches with its adjacent exons.
For the second exon, you have the following alignment from blastx search:
>lcl|34026 Syx7:3_307
Length=22

 Score = 47.8 bits (112),  Expect = 1e-09
 Identities = 22/22 (100%), Positives = 22/22 (100%), Gaps = 0/22 (0%)
Frame = +2

Query 35165  STMQRMVNQLNTPQDSPELKKQ  35230
              STMQRMVNQLNTPQDSPELKKQ
Sbjct  1      STMQRMVNQLNTPQDSPELKKQ  22
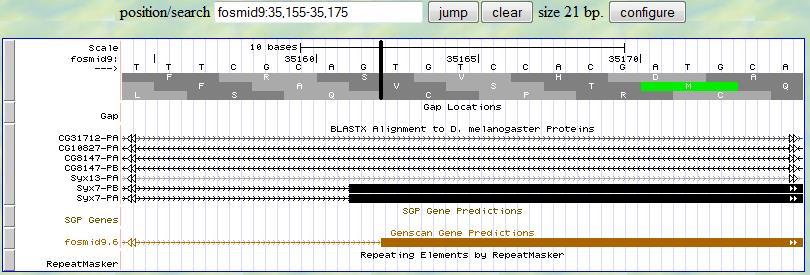
Based on this alignment, you first provide a range (35155-35175) in the genome browser to display the neighborhood of
the matched position (35165). Then you look for the splice site signal (AG) around 35165. You notice that there is
a splice signal (AG) at 35161-2. Sinc the frame is +2, you read the second translation row and you notice that there
are two nucleotides (T and G) before the first complete codon of this exon (TCC in this example), which is exactly what you expected
since the previous exon has one extra nucleotide (G) after all complete codons at the end of the exon (phase 1).
These three nucleotides (G from the previous exon, and TG from this exon) can form a complete codon. Therefore,
the 5' end boundary of the second exon is 35163.
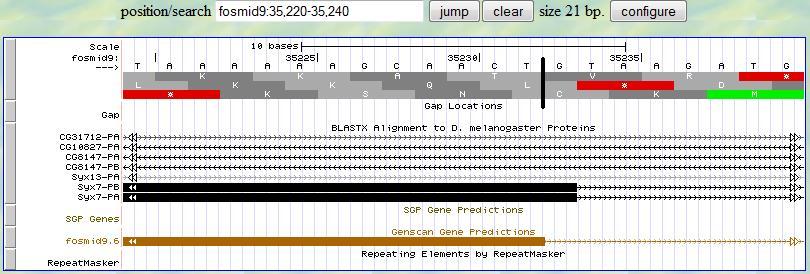
Then you can investigate the 3' end of the second exon. Again, you first provide a range (35220-35240) according to
the alignment from blastx. At the neighborhood of 35230, you find one splice signal (GT)
at 35233-4. Since the frame is +2, you have two nucleotides (C and T) left after the last complete codon in this exon.
Therefore, the 3' end boundary of this second exon is 35232 and the following exon is in phase
2.
Here you record the desired information for the second exon:
Start: 35163
End: 35232
Phase: 2
- Third Exon
>lcl|34027 Syx7:4_307
Length=48

 Score =  100 bits (249),  Expect = 2e-25
 Identities = 48/48 (100%), Positives = 48/48 (100%), Gaps = 0/48 (0%)
 Frame = +2

Query  35516  HQIMTYTNQLVTDTNNQINEVDKCKERHLKIQRDRLVDEFTAALTAFQ  35659
              HQIMTYTNQLVTDTNNQINEVDKCKERHLKIQRDRLVDEFTAALTAFQ
Sbjct  1      HQIMTYTNQLVTDTNNQINEVDKCKERHLKIQRDRLVDEFTAALTAFQ  48
To determine the boundaries of all the other internal exons, the procedure is exactly the same as
the one for the second exon.
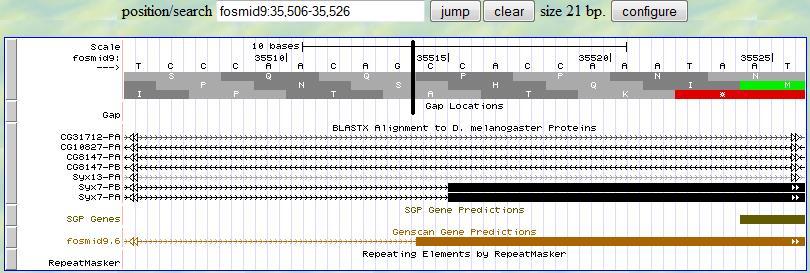
Based on this alignment, you first provide a range (35506-35526) in the genome browser to display the neighborhood of
the matched position (35516). Then you look for the splice site signal (AG) around 35516. You notice that there is
a splice signal (AG) at 35513-4. Sinc the frame is +2, you read the second translation row and you notice that there
is one nucleotide (C) before the first complete codon (CAC in this example) in this exon, which is exactly what you expected
since the previous exon has two extra nucleotides (C and T) after all complete codons at the end of the exon (phase 1).
These three nucleotides (C and T from the previous exon, and C from this exon) can form a complete codon. Therefore,
the 5' end boundary of this exon is 35515.
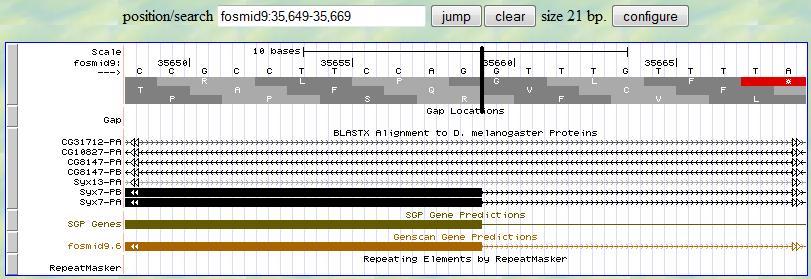
Then you can investigate the 3' end of the third exon. Again, you first provide a range (35649-35669) according to
the alignment from blastx. At the neighborhood of 35659, you find one splice signal (GT)
at 35660-1. Since the frame is +2, you notice that this exon ends with one complete codon (CAG). Therefore,
the 3' end boundary of this exon is 35659 and the following exon is in phase
0.
Here you record the desired information for the third exon:
Start: 35515
End: 35659
Phase: 0
- Fourth Exon
>lcl|34028 Syx7:5_307
Length=139

 Score =  264 bits (674),  Expect = 4e-74
 Identities = 135/139 (97%), Positives = 138/139 (99%), Gaps = 0/139 (0%)
 Frame = +2

Query  35741  AVQRKTADIEKTALRQARGDSYNIARPPGSSRTGSSNSSASQQDNNSFFEDNFFNRKSNQ  35920
              +VQRKTADIEKTALRQARGDSYNIARPPGSSRTGSSNSSASQQDNNSFFEDNFFNRKSNQ
Sbjct  1      SVQRKTADIEKTALRQARGDSYNIARPPGSSRTGSSNSSASQQDNNSFFEDNFFNRKSNQ  60

Query  35921  QQLQTQMQEQVDLQALEEQEQVIRELENNIVGVNEIYKKLGALVYEQGLTVDSIESQVEQ  36100
              QQ+QTQM+EQ DLQALEEQEQVIRELENNIVGVNEIYKKLGALVYEQGLTVDSIESQVEQ
Sbjct  61     QQMQTQMEEQADLQALEEQEQVIRELENNIVGVNEIYKKLGALVYEQGLTVDSIESQVEQ  120

Query  36101  TSIFVSQGTENLRKASSYR  36157
              TSIFVSQGTENLRKASSYR
Sbjct  121    TSIFVSQGTENLRKASSYR  139
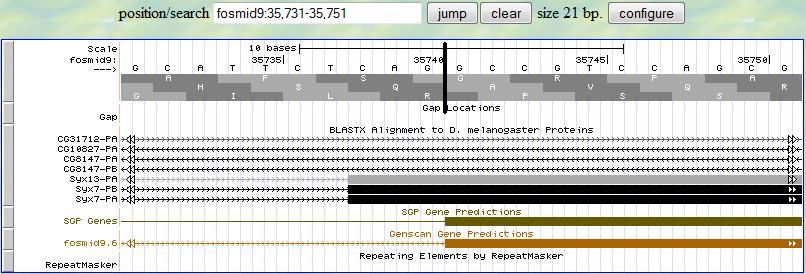
Based on this alignment, you first provide a range (35731-35751) in the genome browser to display the neighborhood of
the matched position (35741). Then you look for the splice site signal (AG) around 35741. You notice that there is
a splice signal (AG) at 35739-35740. Sinc the frame is +2, you read the second translation row and you notice that
this exon starts with a complete codon, which is exactly what you expected since the previous exon ends with a
complete codon. Therefore, the 5' end boundary of this exon is 35741.
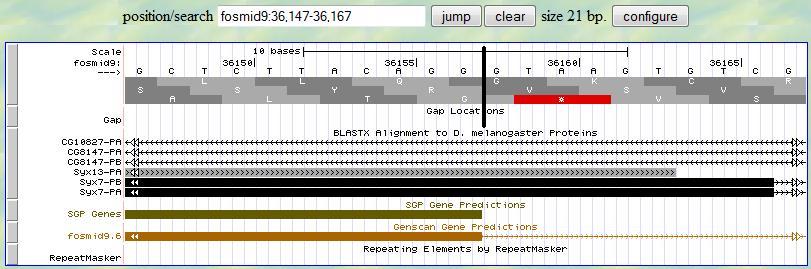
Then you can investigate the 3' end of this exon. You first provide a range (36147-36167) according to
the alignment from blastx. At the neighborhood of 36157, you find one splice signal (GT)
at 36158-9. Since the frame is +2, you notice that this exon ends with one complete codon (AGG). Therefore,
the 3' end boundary of this exon is 36157 and the following exon is in phase
0.
Here you record the desired information for the fourth exon:
Start: 35741
End: 36157
Phase: 0
- Fifth Exon
>lcl|34029 Syx7:6_307
Length=32

 Score = 59.3 bits (142),  Expect = 5e-13
 Identities = 31/32 (97%), Positives = 31/32 (97%), Gaps = 0/32 (0%)
 Frame = +3

Query  36213  NKVRKKKLILVGILSAVLLAIILILVFQFKN*  36308
              NKVRKKKLILVGILSAVLLAIILILVFQFKN
Sbjct  1      NKVRKKKLILVGILSAVLLAIILILVFQFKNX  32
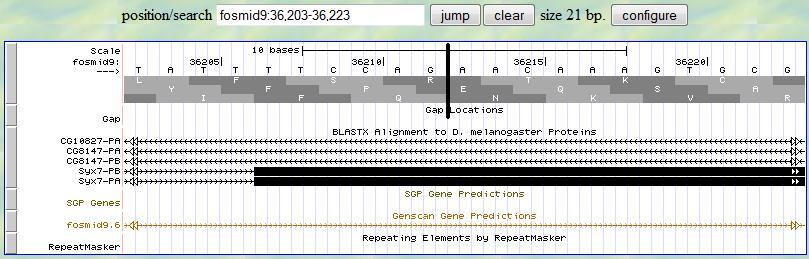
Based on this alignment, you first provide a range (36203-36223) in the genome browser to display the neighborhood of
the matched position (36213). Then you look for the splice site signal (AG) around 36213. You notice that there is
a splice signal (AG) at 36211-2. Sinc the frame is +3, you read the third translation row and you notice that
this exon starts with a complete codon, which is exactly what you expected since the previous exon ends with a
complete codon. Therefore, the 5' end boundary of this exon is 36213.
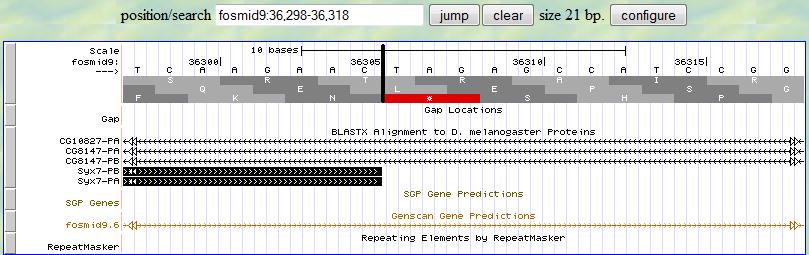
Then you can investigate the 3' end of this exon. You first provide a range (36298-36318) according to
the alignment from blastx. Since this is the last exon in this gene,
at the neighborhood of 36308, you look for the stop codon (TAA/TAG/TGA) and you notice one
at 36306-8 in the third translation row (since the frame is +3). Therefore,
the 3' end boundary of this exon is 36305 and the stop codon locates at 36306-8.
Here you record the desired information for the fourth exon:
Start: 36213
End: 36305
Stop Codon: 36306-8
-
If the gene is one the reverse strand (frame -1, -2, or -3), make sure the arrow at the top left corner of the
browser points to the left hand side. When you do the annotation, process every exon from right to left. When you
read the signals, read them from right to left. Other than these, all the other steps are the same as described
above.
-
Sometimes you have a gene with one single exon. In this case, you only need to identify start codon (ATG) and stop
codon (TAA/TAG/TGA) to determine the boundary of the exon.
Forward strand:
Reverse strand:
-
Sometimes you may have a partial gene, instead of one complete gene in your sequence. In the case, you may notice
that some blastx alignment is pretty bad. In that case, you only annotate the ones with good matches and ignore the
ones with bad matches.
-
Sometimes, you cannot find significant match when you search the predicted gene to the D.mel protein database. In
this case, you just ignore that prediction gene and move to a different one. Most likely, this is a wrong
prediction and it is not worth to perform further investigation.
-
After the locations of all the exons of one isoform are determined, enter the obtained gene
model into gene model checker
to check the correctness of this obtained gene model. If this gene model passes the test,
three files will be generated (nucleotide sequence of the gene, protein sequence of the gene,
gene annotation) and the obtained gene model can be viewed in the genome browser. Collect all
these results and put them into annotation project report.
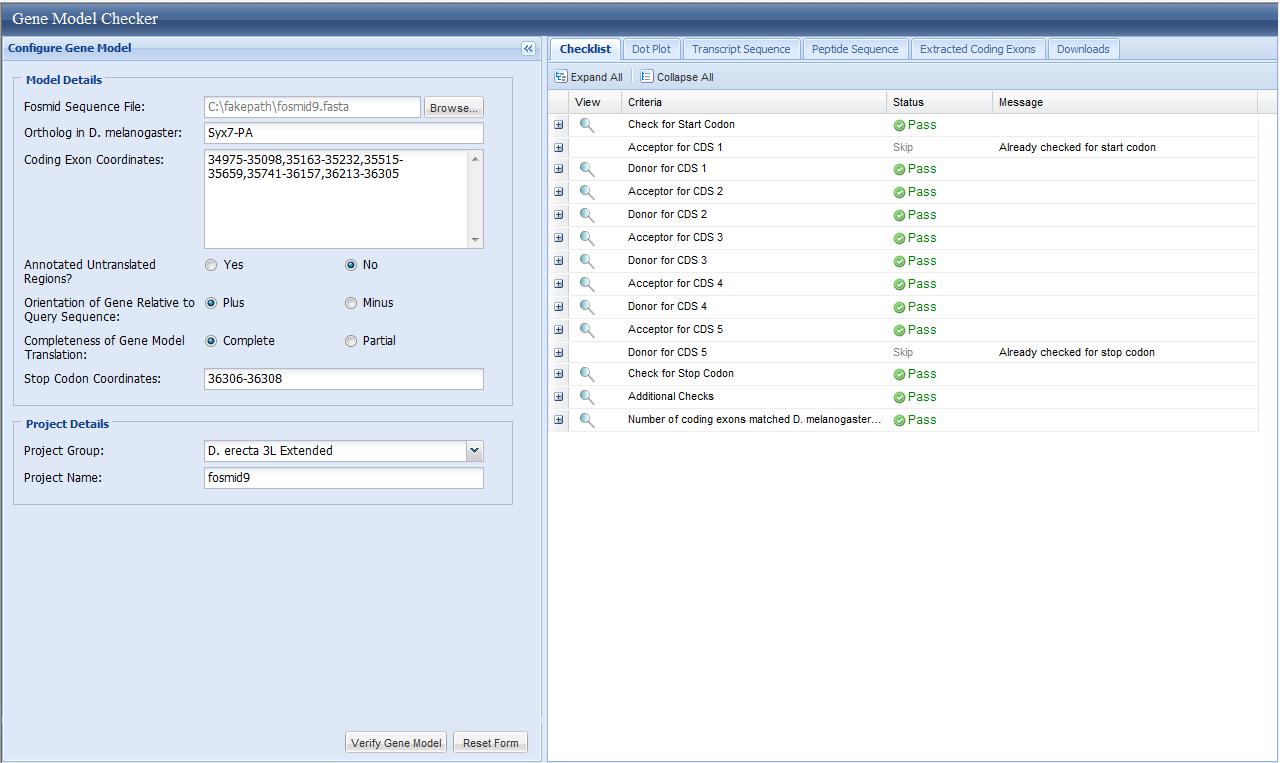
Click the magnifier at the last line of the checklist, a UCSC genome browser feature view will pop up and
the gene you annotate will be shown as "Custom Gene Model" in the genome browser.
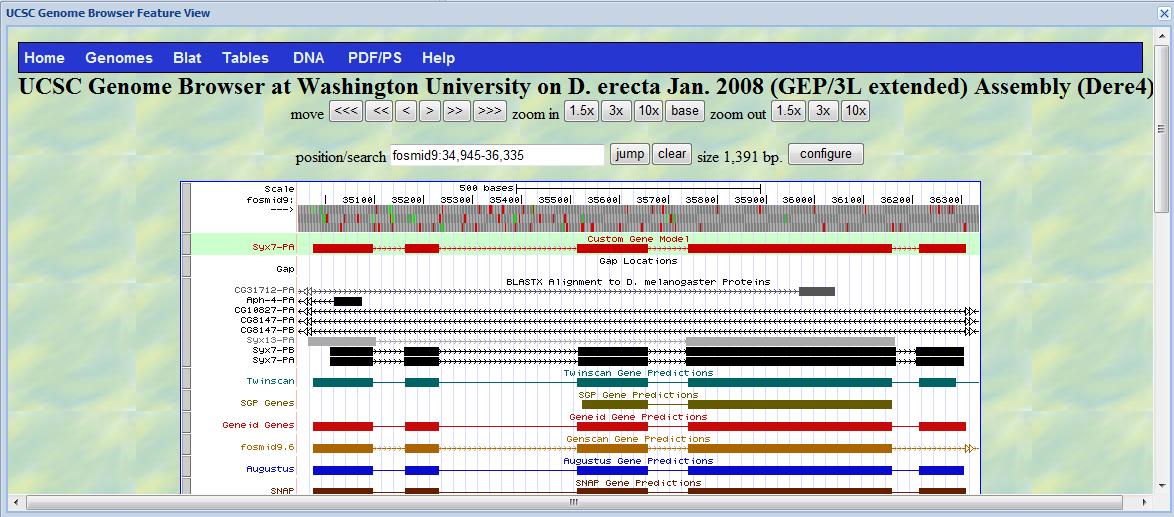
Click the "Download" tab at the top right corner, you will be able to download three files, one is a GFF
file (one standard gene annotation file); one is a nucleotide sequence of the gene; and one is a peptide sequence
of the gene. Download these three files and put them into your project report.
track name="CustomModel" description="Custom Gene Model" color=200,0,0 visibility=2
fosmid9	GEP	CDS	34975	35098	.	+	0	gene_id "Syx7-PA"; transcript_id "Syx7-PA";
fosmid9	GEP	CDS	35163	35232	.	+	2	gene_id "Syx7-PA"; transcript_id "Syx7-PA";
fosmid9	GEP	CDS	35515	35659	.	+	1	gene_id "Syx7-PA"; transcript_id "Syx7-PA";
fosmid9	GEP	CDS	35741	36157	.	+	0	gene_id "Syx7-PA"; transcript_id "Syx7-PA";
fosmid9	GEP	CDS	36213	36305	.	+	0	gene_id "Syx7-PA"; transcript_id "Syx7-PA";
fosmid9	GEP	stop_codon	36306	36308	.	+	.	gene_id "Syx7-PA"; transcript_id "Syx7-PA";
fosmid9	GEP	exon	34975	35098	.	+	.	gene_id "Syx7-PA"; transcript_id "Syx7-PA";
fosmid9	GEP	exon	35163	35232	.	+	.	gene_id "Syx7-PA"; transcript_id "Syx7-PA";
fosmid9	GEP	exon	35515	35659	.	+	.	gene_id "Syx7-PA"; transcript_id "Syx7-PA";
fosmid9	GEP	exon	35741	36157	.	+	.	gene_id "Syx7-PA"; transcript_id "Syx7-PA";
fosmid9	GEP	exon	36213	36305	.	+	.	gene_id "Syx7-PA"; transcript_id "Syx7-PA";
>Syx7-PA_transcript
ATGGACTTGCAGCATATGGAGAATGGCCTAAGTGGCGGGGGCGGAGGGGGTGGTCTTAGC
GAAATAGATTTCCAAAGGCTGGCCCAGATTATAGCCACCAGCATCCAGAAGGTGCAGCAG
AATGTGTCCACGATGCAGCGCATGGTCAATCAACTAAACACGCCCCAGGATTCCCCGGAG
CTAAAAAAGCAACTCCACCAAATAATGACCTACACCAACCAGCTAGTGACCGACACAAAC
AATCAAATCAACGAGGTGGACAAGTGCAAGGAGCGCCATCTGAAGATCCAGCGGGATAGG
CTCGTGGACGAGTTCACGGCGGCACTGACCGCCTTCCAGGCCGTCCAGCGCAAAACGGCG
GACATAGAGAAGACGGCGTTGCGGCAGGCGCGCGGAGATAGCTACAACATCGCCCGTCCA
CCCGGCTCATCGCGTACCGGCAGCTCCAACAGCAGCGCCAGCCAGCAGGACAACAACTCA
TTCTTTGAGGACAACTTCTTCAATCGCAAATCAAACCAGCAACAACTGCAGACTCAGATG
CAGGAGCAGGTGGACCTGCAGGCCCTCGAGGAACAAGAGCAGGTCATCCGGGAGCTTGAG
AACAACATCGTGGGCGTGAACGAGATATACAAAAAGCTGGGCGCCCTGGTCTACGAACAG
GGACTGACGGTGGACTCCATCGAGTCGCAGGTGGAACAGACTAGCATTTTCGTCTCACAG
GGCACGGAAAATCTGCGCAAGGCGAGCTCTTACAGGAACAAAGTGCGAAAGAAGAAGCTG
ATTTTGGTGGGCATCCTGAGCGCCGTGCTGCTGGCCATAATCTTGATACTCGTCTTTCAG
TTCAAGAAC
>Syx7-PA_peptide
MDLQHMENGLSGGGGGGGLSEIDFQRLAQIIATSIQKVQQNVSTMQRMVNQLNTPQDSPE
LKKQLHQIMTYTNQLVTDTNNQINEVDKCKERHLKIQRDRLVDEFTAALTAFQAVQRKTA
DIEKTALRQARGDSYNIARPPGSSRTGSSNSSASQQDNNSFFEDNFFNRKSNQQQLQTQM
QEQVDLQALEEQEQVIRELENNIVGVNEIYKKLGALVYEQGLTVDSIESQVEQTSIFVSQ
GTENLRKASSYRNKVRKKKLILVGILSAVLLAIILILVFQFKN
Take the obtained peptide sequence and search against D.mel protein database
using BLASTP on NCBI (choose database "Reference protein (refseq_protein)" and
enter "7227" into "Organism" option) and save the obtained best alignment
in your project report.
>ref|NP_730632.1| UniGene info linked to NP_730632.1Gene info linked to NP_730632.1 syntaxin 7, isoform A [Drosophila melanogaster]
 ref|NP_730633.1| Gene info linked to NP_730633.1 syntaxin 7, isoform B [Drosophila melanogaster]
Length=282

 GENE ID: 36173 Syx7 | Syntaxin 7 [Drosophila melanogaster]
(Over 10 PubMed links)

 Score =  489 bits (1260),  Expect = 6e-139, Method: Compositional matrix adjust.
 Identities = 277/283 (98%), Positives = 280/283 (99%), Gaps = 1/283 (0%)

Query  1    MDLQHMENGLSGGGGGGGLSEIDFQRLAQIIATSIQKVQQNVSTMQRMVNQLNTPQDSPE  60
            MDLQHMENGLSGGGGGG  SEIDFQRLAQIIATSIQKVQQNVSTMQRMVNQLNTPQDSPE
Sbjct  1    MDLQHMENGLSGGGGGGL-SEIDFQRLAQIIATSIQKVQQNVSTMQRMVNQLNTPQDSPE  59

Query  61   LKKQLHQIMTYTNQLVTDTNNQINEVDKCKERHLKIQRDRLVDEFTAALTAFQAVQRKTA  120
            LKKQLHQIMTYTNQLVTDTNNQINEVDKCKERHLKIQRDRLVDEFTAALTAFQ+VQRKTA
Sbjct  60   LKKQLHQIMTYTNQLVTDTNNQINEVDKCKERHLKIQRDRLVDEFTAALTAFQSVQRKTA  119

Query  121  DIEKTALRQARGDSYNIARPPGSSRTGSSNSSASQQDNNSFFEDNFFNRKSNQQQLQTQM  180
            DIEKTALRQARGDSYNIARPPGSSRTGSSNSSASQQDNNSFFEDNFFNRKSNQQQ+QTQM
Sbjct  120  DIEKTALRQARGDSYNIARPPGSSRTGSSNSSASQQDNNSFFEDNFFNRKSNQQQMQTQM  179

Query  181  QEQVDLQALEEQEQVIRELENNIVGVNEIYKKLGALVYEQGLTVDSIESQVEQTSIFVSQ  240
            +EQ DLQALEEQEQVIRELENNIVGVNEIYKKLGALVYEQGLTVDSIESQVEQTSIFVSQ
Sbjct  180  EEQADLQALEEQEQVIRELENNIVGVNEIYKKLGALVYEQGLTVDSIESQVEQTSIFVSQ  239

Query  241  GTENLRKASSYRNKVRKKKLILVGILSAVLLAIILILVFQFKN  283
            GTENLRKASSYRNKVRKKKLILVGILSAVLLAIILILVFQFKN
Sbjct  240  GTENLRKASSYRNKVRKKKLILVGILSAVLLAIILILVFQFKN  282